
Suflex
Otimizando o Processo Manual de Contagem de Estoque
A contagem de estoque e insumos é uma atividade essencial em cozinhas de restaurantes. Nossa solução revoluciona esse processo centralizando o gerenciamento de inventário, substituindo papel, caneta e planilhas por tecnologia. Agora, a contagem é feita de maneira prática e precisa usando QR codes em etiquetas, garantindo uma operação mais eficiente, moderna e totalmente integrada ao fluxo de trabalho diário da cozinha.
Responsabilidades
As a Product Designer, I was responsible for leading the entire research process, where I was able to map the user journey, identifying the main barriers in the user experience. I wrote research scripts for in-person user interviews. Later, I created prototypes, performed usability tests, and defined metrics to validate the improvements made.Estrutura da Equipe
Product: Ramon Sousa (PD), Leo Coitim (PM), Developers, QA, and StakeholdersLinha do tempo e plataforma
2023 - 2024 | Web (Desktop, Tablet & Mobile)Ferramentas
Miro, Notion, Hotjar, Google Analytics, Figma, Maze.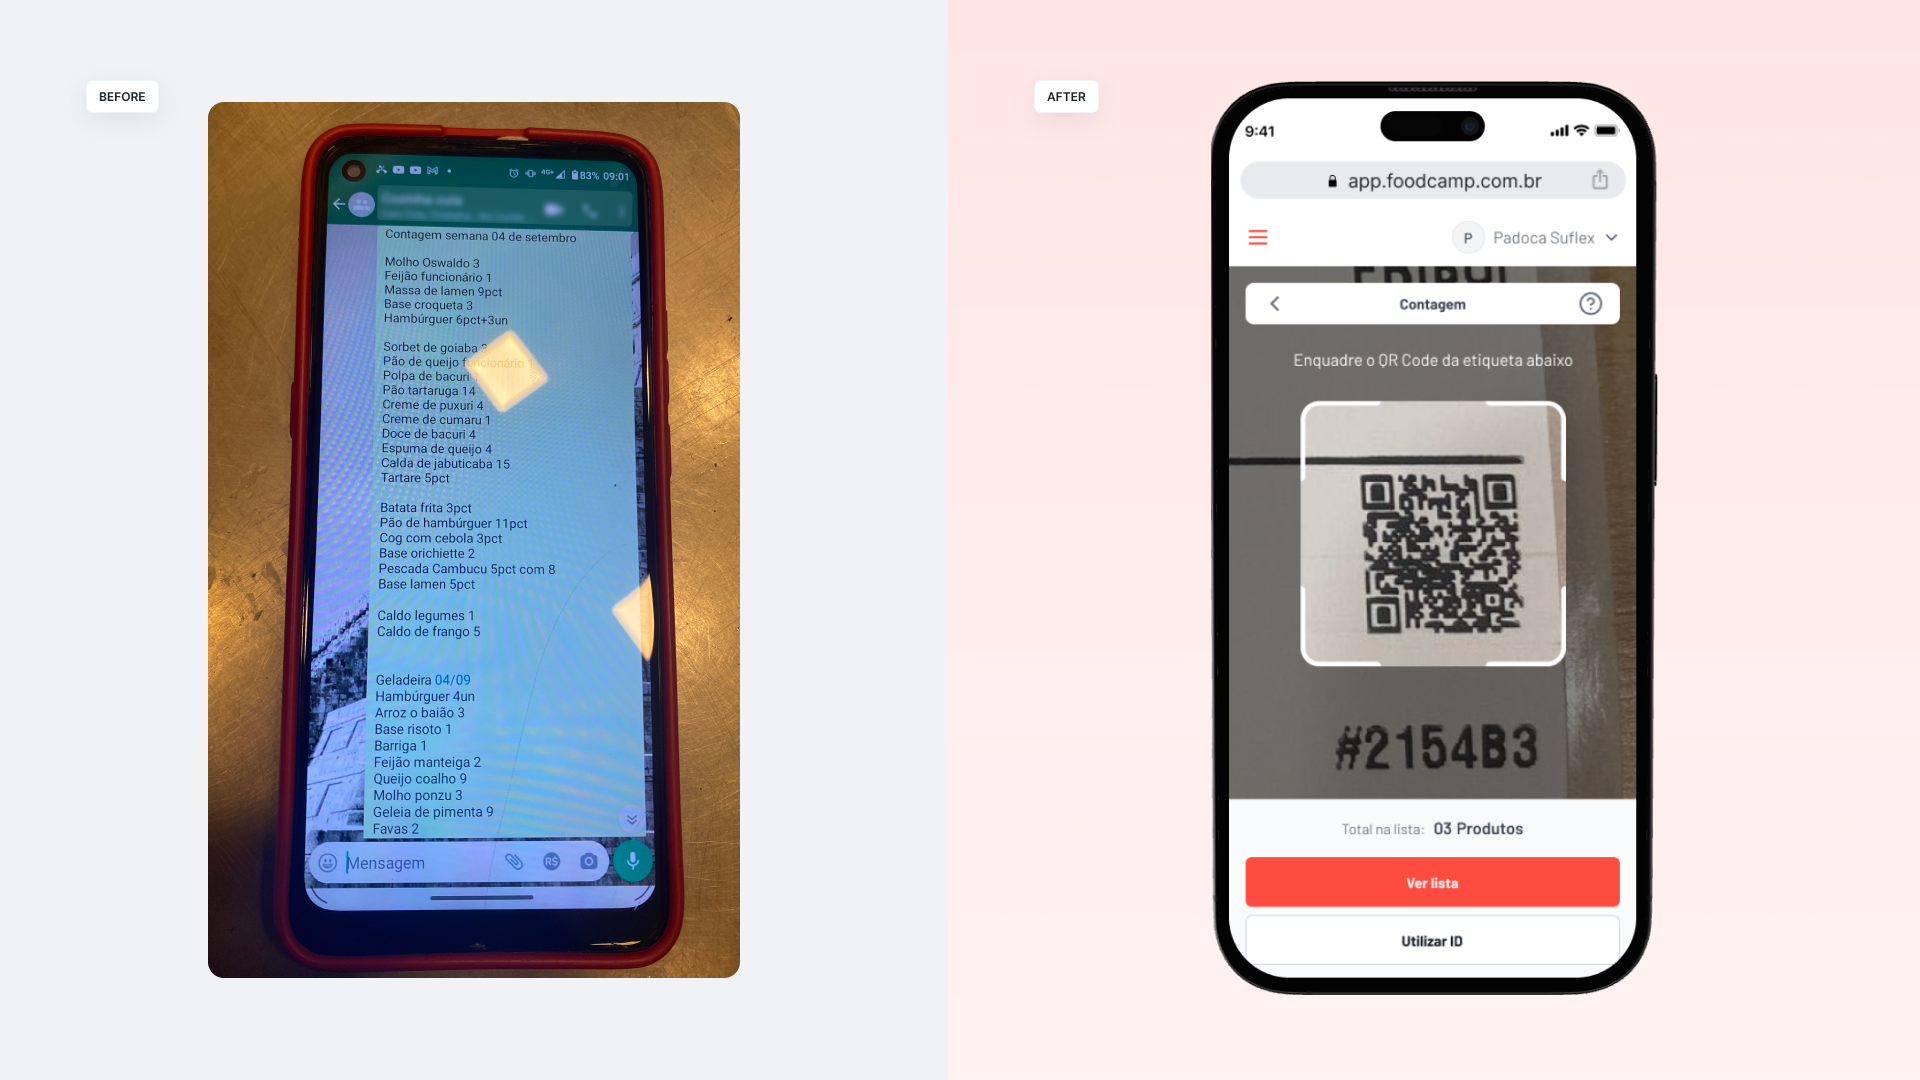
Research steps
1
Conduct a CSD Matrix to build the research script2
Semistructured interview for data collection.3
Development of a service blueprint for user validation.4
Creation of a storyboard.5
Blueprint validation interviewGoal:Identify recurring pain points in restaurant management and operations, and explore, as a product team, solutions that can effectively address these needs.
Research and Data Collection
After CSD Matrix, we conducted the research with 6 restaurant owners, our goal was to map the restaurant's routine and identify points where we could help.
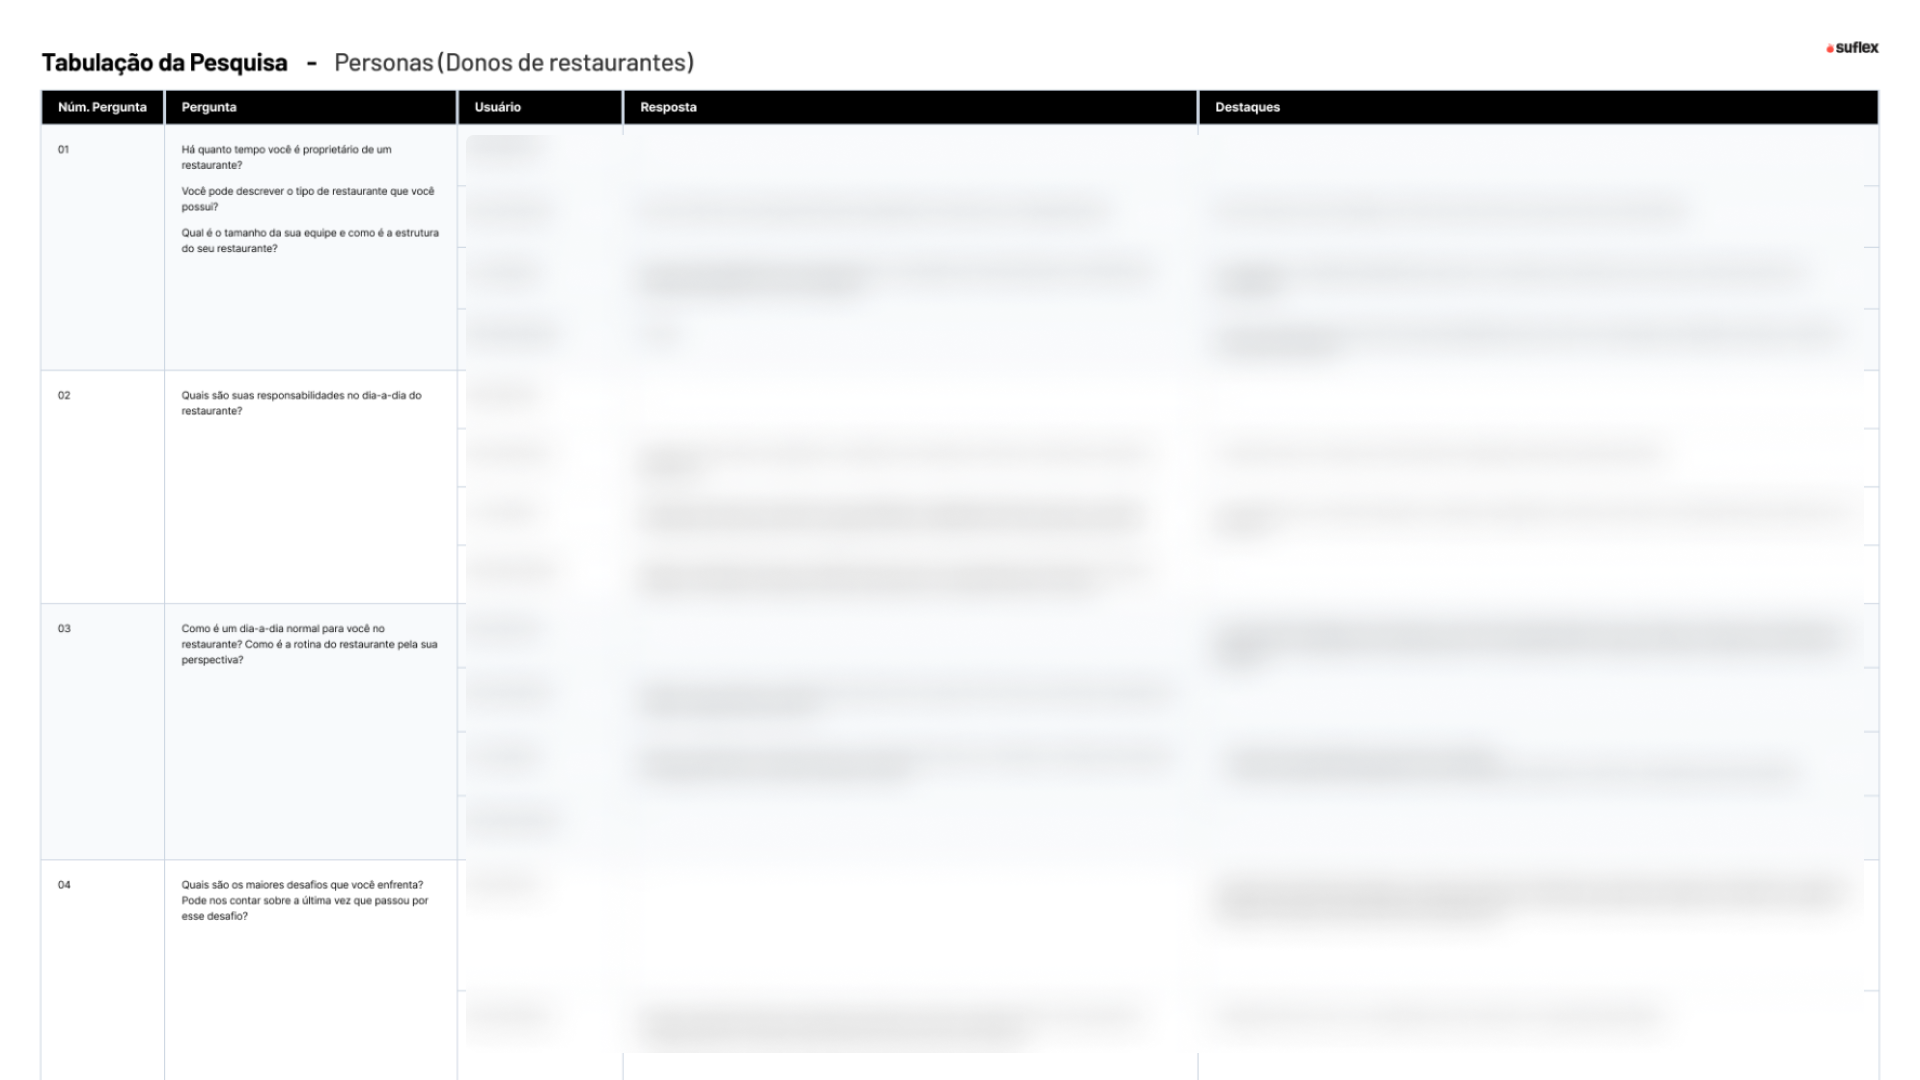
Interview answers has been blurred to preserve confidential informations.
After first research
During the research phase, we identified several recurring pain points among the interviewees, including a lack of control over inventory due to reliance on manual processes, high employee turnover coupled with challenges in training and production planning, the complexity of managing work schedules and supplier communication, and an overdependence on Excel, highlighting the pressing need for automation to improve efficiency and accuracy.
The manual process of counting stock.
Mapping the Service Blueprint:
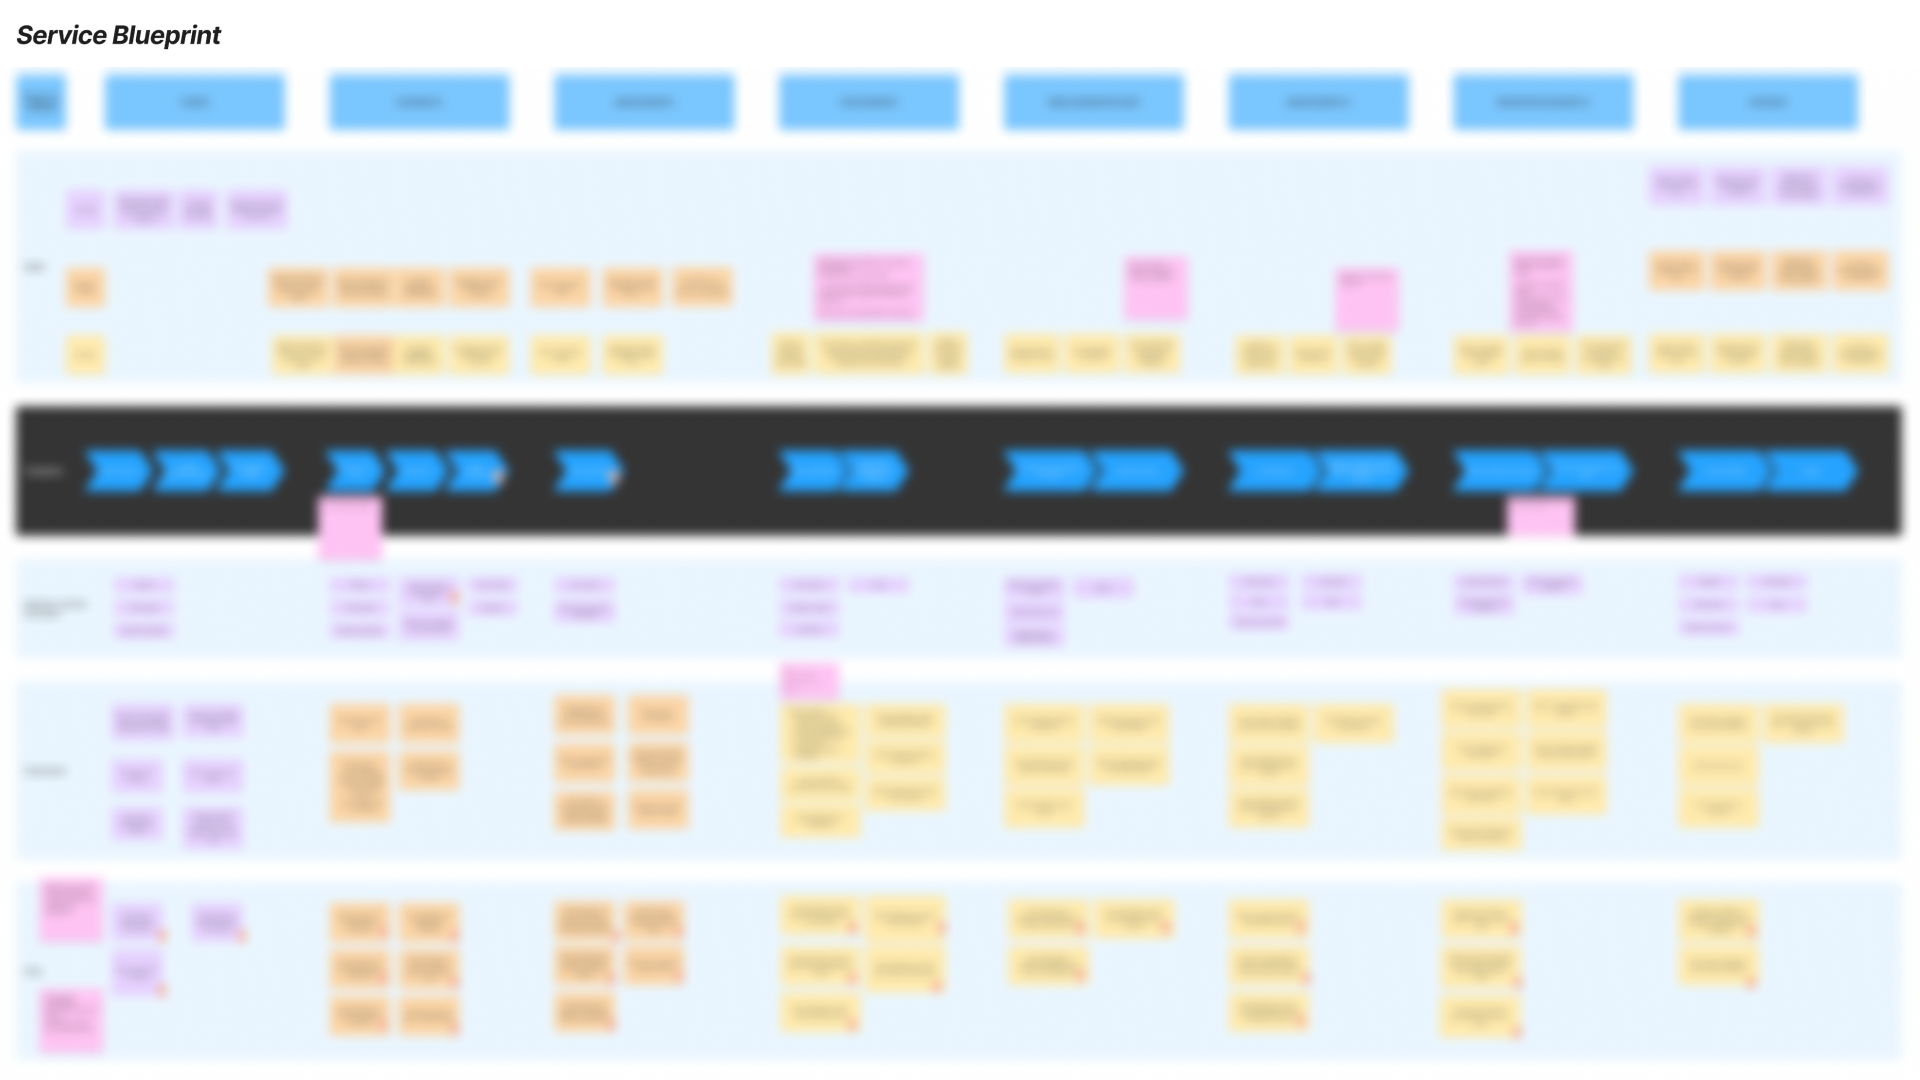
After completing the initial interviews, we began mapping the operational journey within the restaurant. Our goal was to clearly understand who was responsible for each stage, identify competitors, as well as capture emotions, questions, and potential areas where the product could provide value.
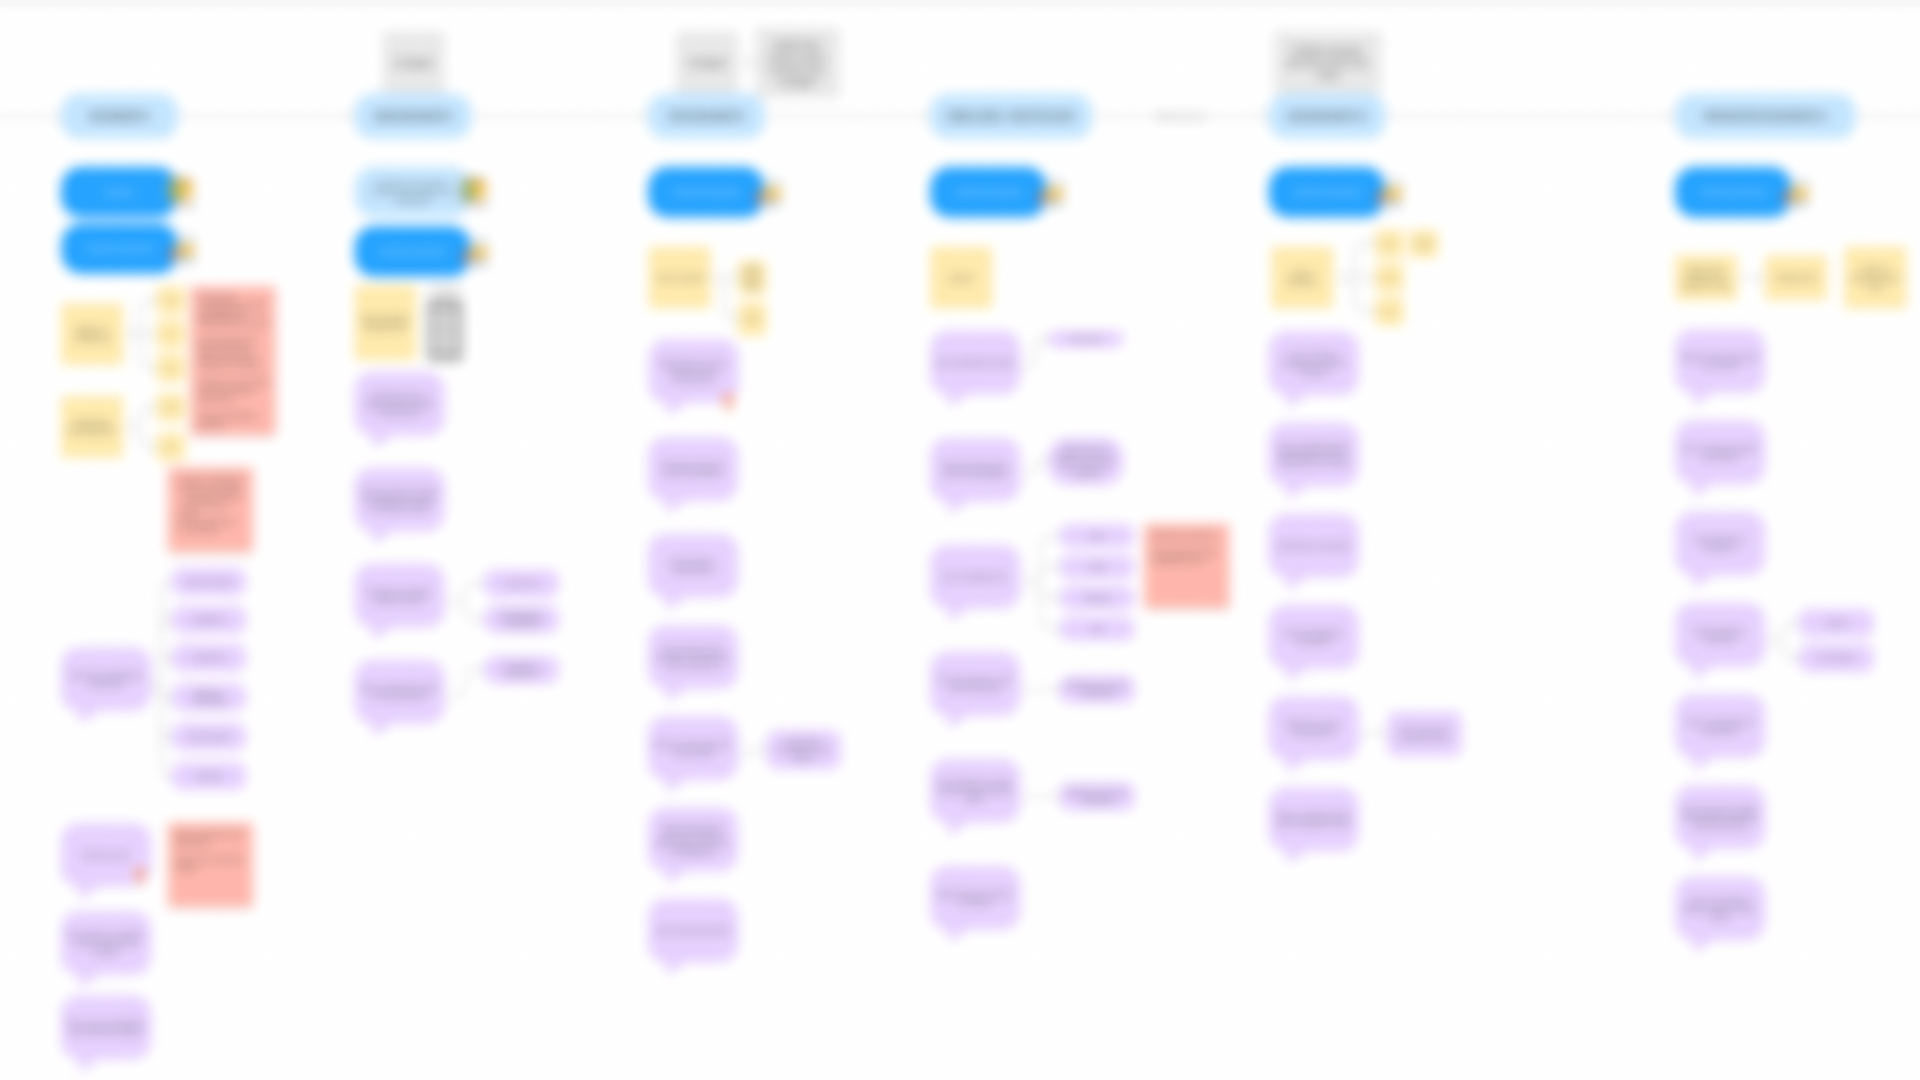
Sketch from service blueprint
Kitchen journey mapped
After validating the service blueprint with new interviewees, we gained a clear understanding of the key stages of this journey and the main pain points in restaurant operations. Our next step was to validate which stages would be the most effective for us to address.
Kitchen journey
Challenges Encountered
Once we determined that the Stock Counting stage would be prioritized, we outlined the primary objectives our solution needed to achieve: eliminating manual processes for stock counting, ensuring frequent usage of the feature by our users, and eliminating errors caused by duplicate product counts.
The implementation of this functionality proved to require more effort than initially anticipated.
Proposed Solution
A QR Code was added to the product control label, opening up a wide range of possibilities for exploration as a Product feature. The label became a control point, enabling traceability of supplies, reducing errors from manual processes, and unlocking other potential functionalities.
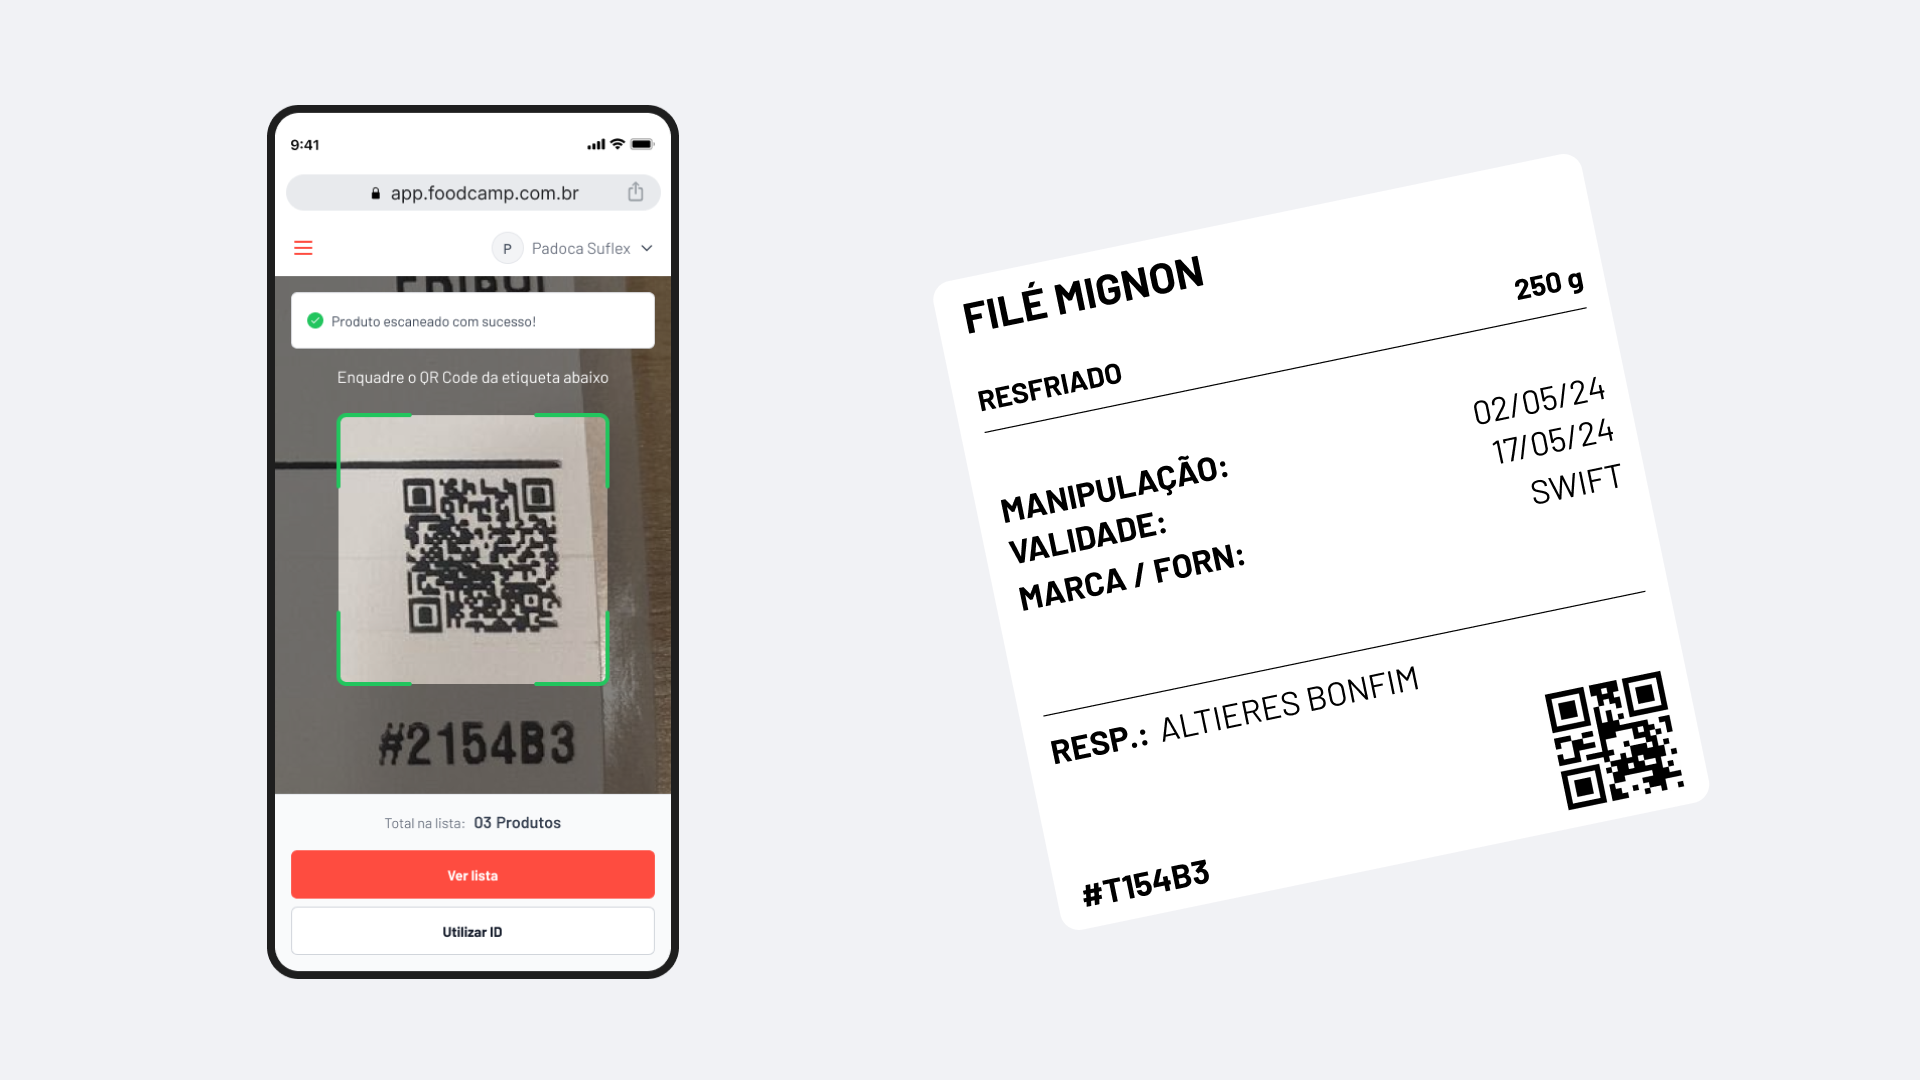
On the left, the screen for QR Code scanning used in stock counting; on the right, the new label structure featuring the QR Code.
Results
+94%
After the launch, we observed that approximately 94% of users returned to the app to use the feature again after their first experience, demonstrating a high initial engagement rate.2:23
The average session time recorded was 2 minutes and 23 seconds. By analyzing usage recordings, we noticed that many users completed one counting process and immediately started another, suggesting they were counting different physical areas within their operations, such as distinct sections of a restaurant or kitchen.14.3%
Despite this high initial engagement, we identified an abandonment rate that, although expected during the first months of experimentation, could be reduced. One of the main contributing factors was the warning modal displayed when scanning an already registered label. In some cases, this alert interrupted the user's journey, making the experience less seamless.I used tools like Google Analytics and Hotjar to monitor platform performance over a twoo-month period.